

5 Ways Chicago Home Prices Compare in 2026
Chicago home prices rose 6.7% year over year in August, making the metro the nation’s strongest among the reported major markets for the sixth consecutive month. Prices also increased in New York and Cleveland, while Seattle declined and Denver barely grew. The Midwest is outperforming many regions, although gains remain below inflation.
What happened to home prices in August 2026?
Home prices increased nationally in August, but the pace of appreciation did not keep up with inflation, according to recent market reports. That distinction matters: a home may be worth more in dollar terms while delivering weaker purchasing-power growth after accounting for the rising cost of goods and services.
The results also varied sharply by metro area. Chicago led the reported group with a 6.7% annual gain , followed by New York at 6.2% and Cleveland at 4.3% . Denver posted a modest 0.8% increase , while Seattle declined by 2% .
These figures describe year-over-year price changes, not the return on a particular property. Neighborhood, property type, condition, inventory, mortgage rates, and the timing of a sale can all produce different results.
Which U.S. metros are gaining or losing value?
The reported metro comparison shows a wide regional gap:
- Chicago Area +6.7% - Strongest report gain
- New York +6.2% - Strong appreciation
- Cleveland +4.3% - Solid growth
- Denver-0.8% - Nearly flat
- Seattle -1.96% - Annual decline
- Las Vegas -1.29% - Annual decline
- Dallas & Denver -0.79% & -0.76% - Softer conditions
Chicago’s result is notable because it represents the metro’s sixth consecutive month as the leading performer in the comparison. New York’s strength suggests that select large, supply-constrained markets can continue to appreciate even when national growth is moderating.
By contrast, Seattle and Dallas illustrate how local conditions can overpower national trends. Affordability pressure, employment patterns, housing supply, migration, and buyer confidence may differ significantly from one metropolitan area to another.
Why are Chicago home prices outperforming?
Several factors may be supporting Chicago and the broader Midwest housing market:
- Relative affordability: Chicago prices can remain more accessible than those in several coastal markets, helping preserve buyer demand.
- Limited available inventory: When fewer homes are listed, competition can support prices for well-located properties.
- Stable employment centers: Diverse industries and established communities provide a durable foundation for housing demand.
- Buyer migration: Some households may be weighing Midwest costs against expensive coastal markets.
- Seasonal demand: Late-summer activity can support prices, although it should be interpreted alongside inventory and pending-sale data.
Strong metro-level appreciation does not mean every Illinois neighborhood is rising at the same rate. West suburban communities may show different results based on school districts, transportation access, taxes, lot sizes, renovation quality, and the supply of move-in-ready homes.
For a property-specific view, homeowners can request a comparative market analysis , while buyers can review current opportunities through Find a Home .
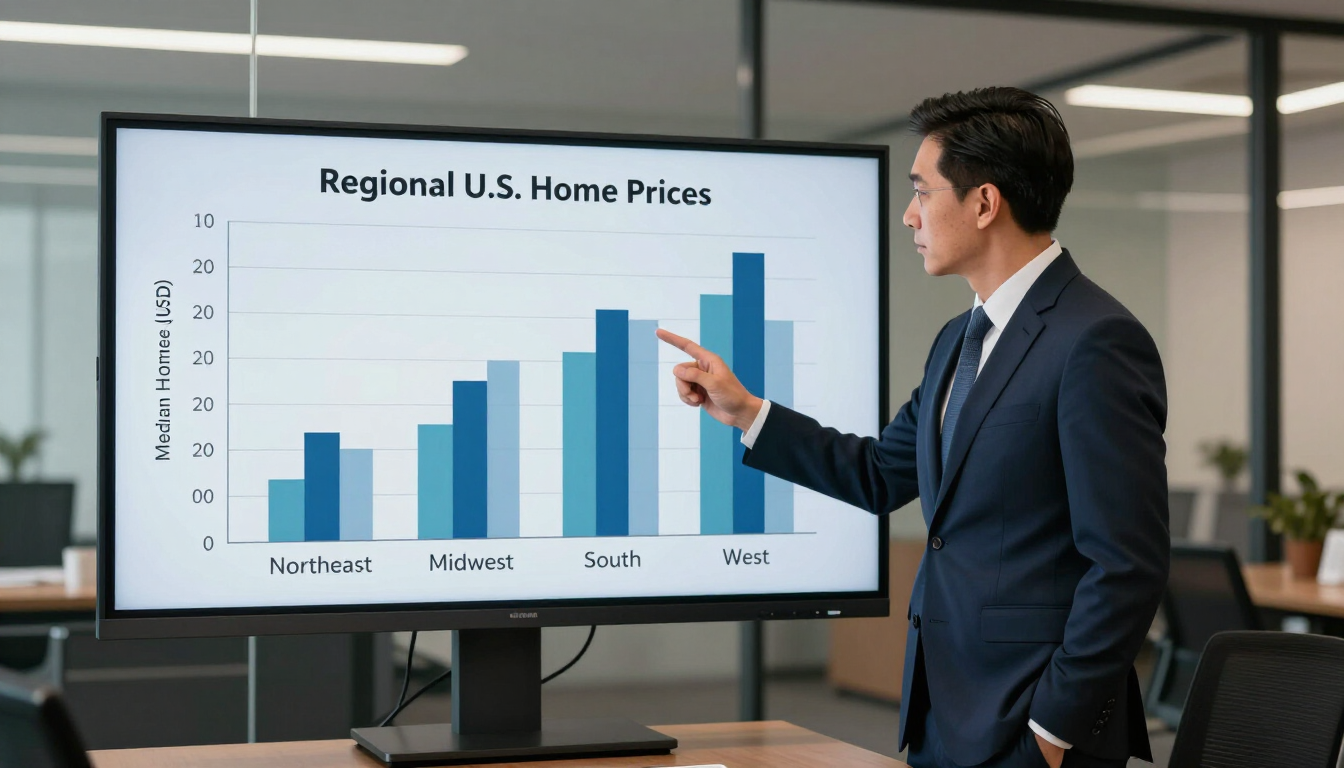
How does the Midwest compare with other regions?
The Midwest’s performance stands out because its gains are occurring amid a more uneven national market. Chicago and Cleveland both posted meaningful annual increases, while several Western and Southern markets have slowed or declined.
That does not make the Midwest universally stronger in every category. Instead, it suggests that regional affordability and local supply-demand conditions are currently providing more support than in some higher-cost markets.
A useful way to interpret the gap is to separate three questions:
- Are prices rising? Chicago’s reported annual gain says yes.
- Are homes becoming more affordable? Not necessarily, because prices can rise faster than household incomes.
- Is the market equally strong everywhere? No. Metro, suburb, neighborhood, and property-level results can vary substantially.
What does the data mean for Chicago buyers?
A rising market can make waiting more expensive, but it does not mean buyers should rush into an unsuitable property. Buyers should evaluate the monthly payment, taxes, insurance, maintenance, commute, and expected time in the home—not only the annual appreciation headline.
Practical steps include:
- Set a payment-based budget before touring homes.
- Compare recent closed sales, not only asking prices.
- Review how long comparable properties remain on the market.
- Ask whether inspection, appraisal, or financing contingencies are appropriate.
- Consider multiple neighborhoods rather than relying on one metro average.
A knowledgeable local professional can help distinguish a genuinely competitive listing from one that is simply priced above recent evidence. Start with the area’s available services or contact a professional for guidance.
What should Chicago sellers do now?
The reported 6.7% gain creates a favorable backdrop for sellers, but strong market conditions do not eliminate the need for preparation. Buyers remain sensitive to monthly affordability, property condition, and value.
Sellers should focus on:
- Pricing from current comparable sales and neighborhood-level evidence.
- Completing repairs that affect inspection results or buyer confidence.
- Presenting clear information about improvements, taxes, and utility costs.
- Using professional photography and a marketing plan suited to the property.
- Reviewing offers by total terms, not just the headline price.
An accurate price can attract more qualified attention and reduce the risk of extended market time. Explore List With Me to discuss positioning, marketing, negotiation, and closing coordination.
Inflation changes how to read the increase
A 6.7% nominal increase sounds strong, but the reports indicate that home prices rose more slowly than inflation. In practical terms, the real gain after inflation is smaller than the advertised percentage.
This distinction is especially important for investors and long-term homeowners. Nominal appreciation can increase equity, while inflation-adjusted performance provides a clearer view of purchasing-power growth. Owners should also consider mortgage principal reduction, rental income, taxes, maintenance, and transaction costs when evaluating investment results.
The same principle applies to affordability. Even if price growth slows, high mortgage rates or rising insurance and tax costs can keep monthly payments elevated. Buyers should compare the complete cost of ownership rather than assuming that slower appreciation automatically means a cheaper market.
Key takeaways for the Chicago market
Chicago home prices were the strongest among the reported major metros in August, with a 6.7% annual increase and a sixth consecutive month in the lead. New York and Cleveland also gained, while Seattle declined, Denver and Dallas reported year-over-year weakness. The Midwest’s relative affordability and supply conditions may be supporting demand, but local results vary. Buyers should use neighborhood-level data and payment-based budgets; sellers should price carefully and prepare competitively. The next step is to compare recent sales and current listings for the specific Illinois community and property type—not rely on a national headline alone.